July 28, 2026
The OSLTT KVM Latency Test: How We Measure Click-to-Photon
Every latency number we publish comes from one rig. Here is exactly how it works, so you can trust the figures and reproduce them yourself.
By Andrew Douglass · Founder
Disclosure: Our articles contain affiliate links, including Amazon. If you buy through one, we may earn a commission at no extra cost to you, and as an Amazon Associate we earn from qualifying purchases. It never affects our testing, measurements, or verdicts. Full disclosure.
An OSLTT KVM latency test measures a KVM over IP's click-to-photon latency: the time from a mouse click to the moment the resulting pixel appears on the remote screen. It uses OSLTT, an open-source light-sensor tool, to time that change objectively, then isolates the delay the KVM itself adds. It is the most reliable way to compare how responsive one IP KVM feels against another.
The rest of this page documents that method in full, because a benchmark you cannot inspect is a benchmark you cannot trust. Every latency figure in our IP KVM reviews comes from this one rig, and the protocol below, along with the open-source tool it runs on, is here so anyone can reproduce and challenge the numbers.
What "click-to-photon" means
Click-to-photon is the honest, end-to-end way to measure interactive latency. It times from the instant an input event fires to the instant light actually changes on the display you are watching. For an IP KVM, that means: you click, the click travels through the KVM's emulated USB mouse to the target, the target's screen changes, the KVM captures and encodes that change, streams it over the network, and your client decodes and displays it. The photon at the end is what you actually perceive, which is why it is the number that matters, and why we label it click-to-photon rather than the narrower "glass-to-glass" (a video-only, screen-to-screen measurement).
What the number includes, and what vendor numbers leave out
A latency figure only means something once you know which parts of the path it counts. Most published KVM numbers count far less than click-to-photon does, which is why they look faster and tell you less.
| Measurement | What it counts | What it leaves out |
|---|---|---|
| Vendor encode time | Capture and encode on the device | Network, decode, display, and the entire input path |
| Glass-to-glass | Screen change to screen change, video only | Your click reaching the target through the KVM |
| Click-to-photon (ours) | Click, USB emulation, target render, capture, encode, network, decode, and display | Nothing in the interactive path; the baselines we subtract are measured and disclosed |
The instrument: OSLTT
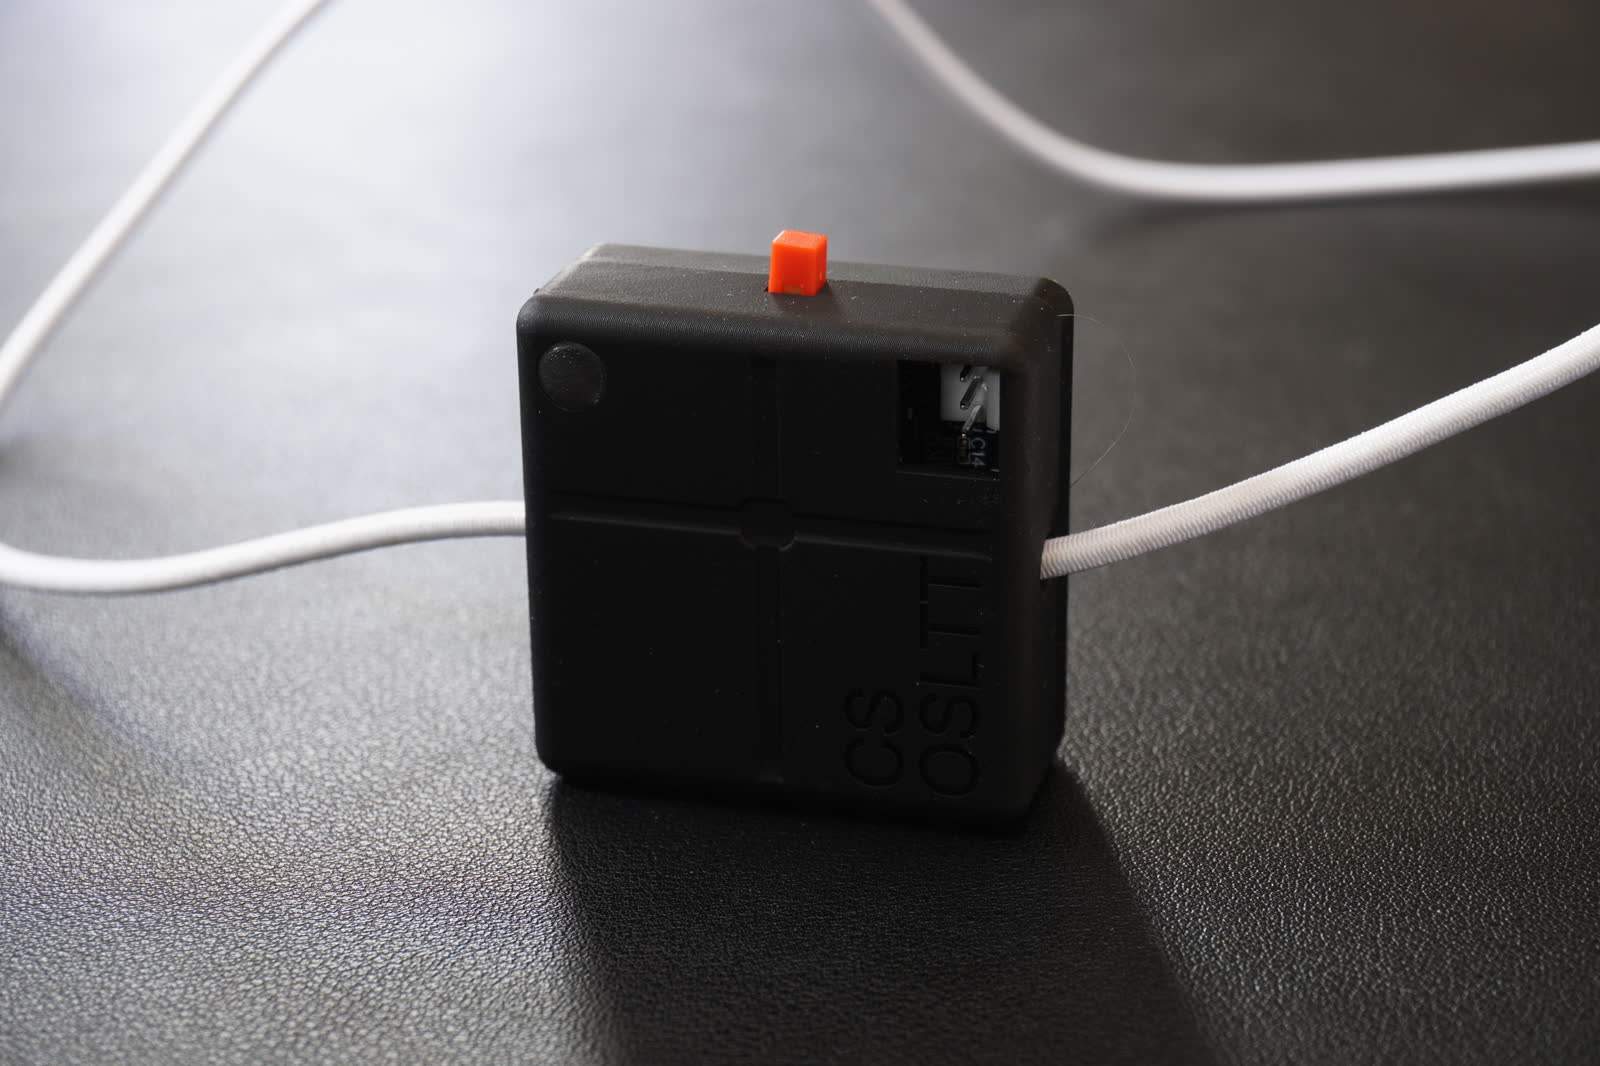
We measure the photon with OSLTT, the Open Source Latency Testing Tool built by TechteamGB. It is a third-party device purpose-built for exactly this kind of end-to-end latency measurement: it injects the input and its light sensor records the moment the screen actually changes, so total click-to-photon latency comes out as an objective, sub-millisecond number rather than a human guess or a high-speed-camera frame count. We did not build it, and full credit for the tool goes to its author. Our part is simply pointing it at a KVM: we route the injected click through the KVM's emulated USB and place the sensor on the client, so what OSLTT times is the full remote path from click to photon.
The rig
The setup has three parts:
- A target machine driving the HDMI the KVM captures. Ours is a desktop with an RTX 2060, which comfortably drives 1080p at 120 Hz, but we run every test at 1080p60 so that even the slowest-capturing device can keep up and the source stays identical across all of them. A clean, capable source means no KVM is advantaged or disadvantaged by a weak signal.
- The KVM under test, capturing that HDMI and emulating the keyboard and mouse, connected over a wired LAN to keep the network variable constant.
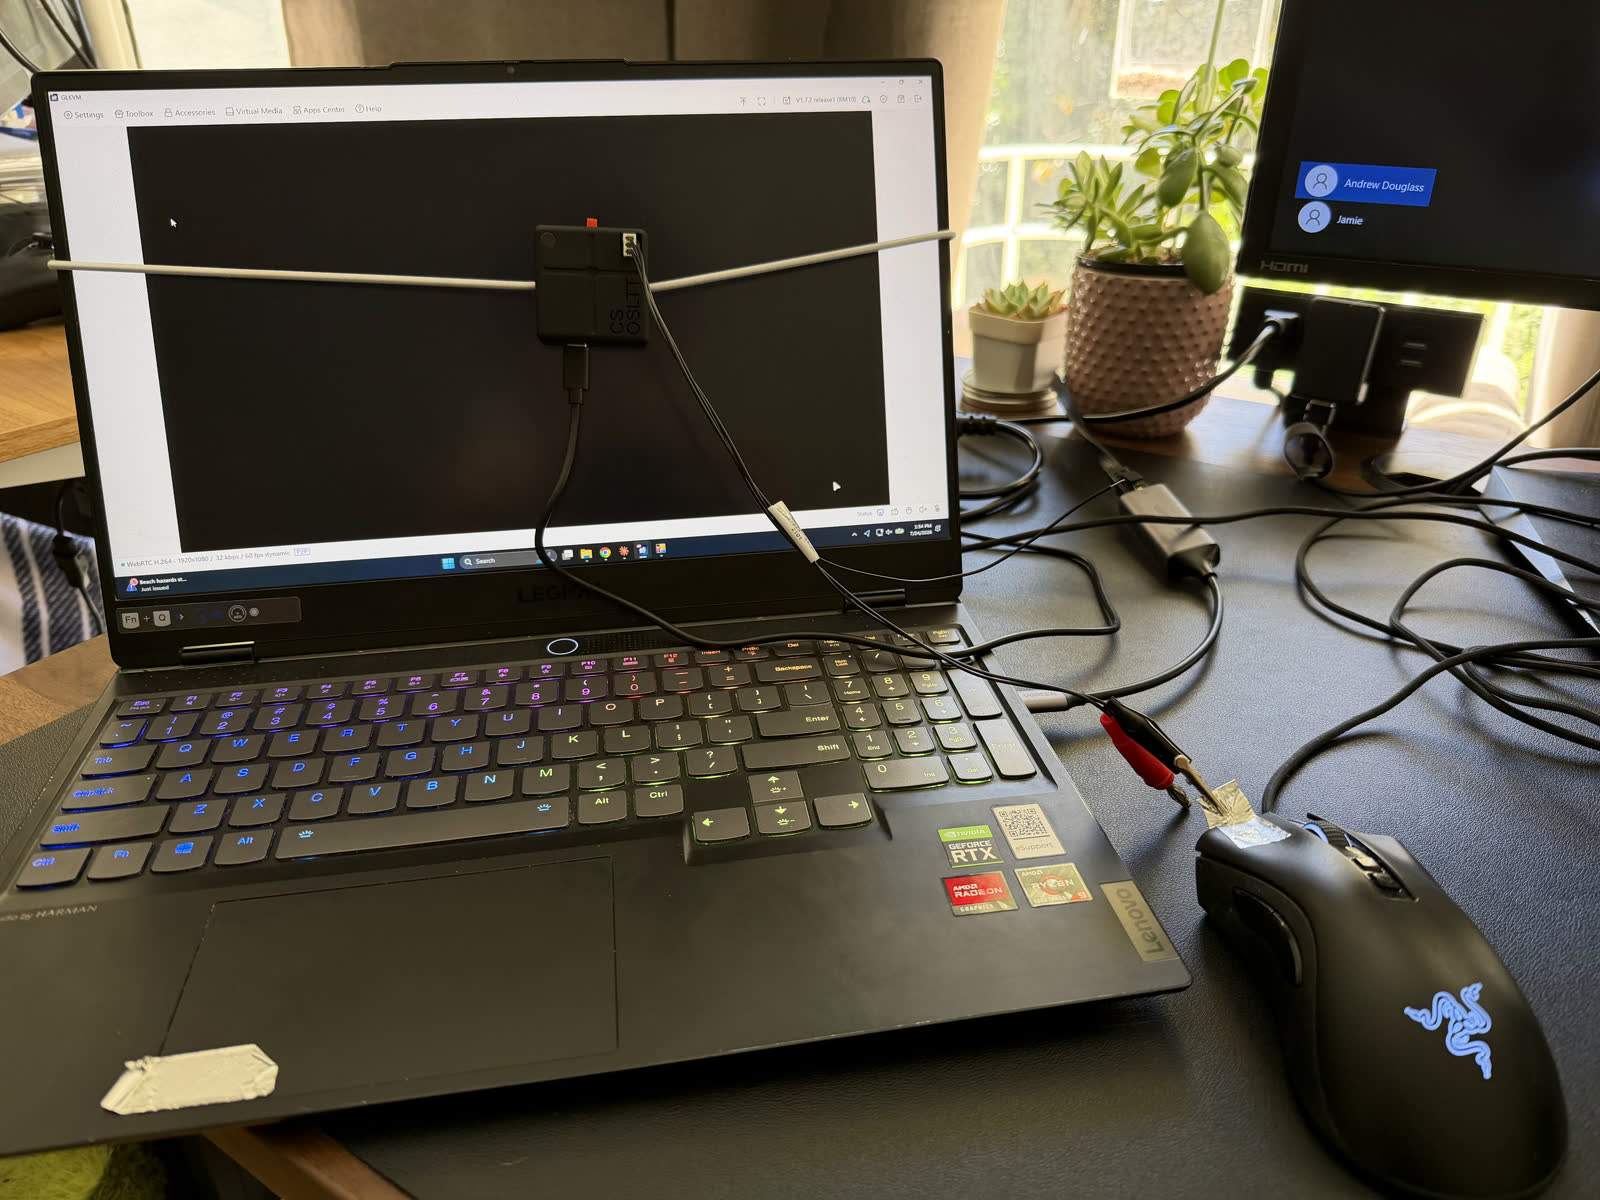
- A client laptop displaying the KVM's stream in a browser, with the OSLTT light sensor placed on its screen over a test region. Its panel is 165 Hz capable, so the client side never becomes the bottleneck in what we measure.
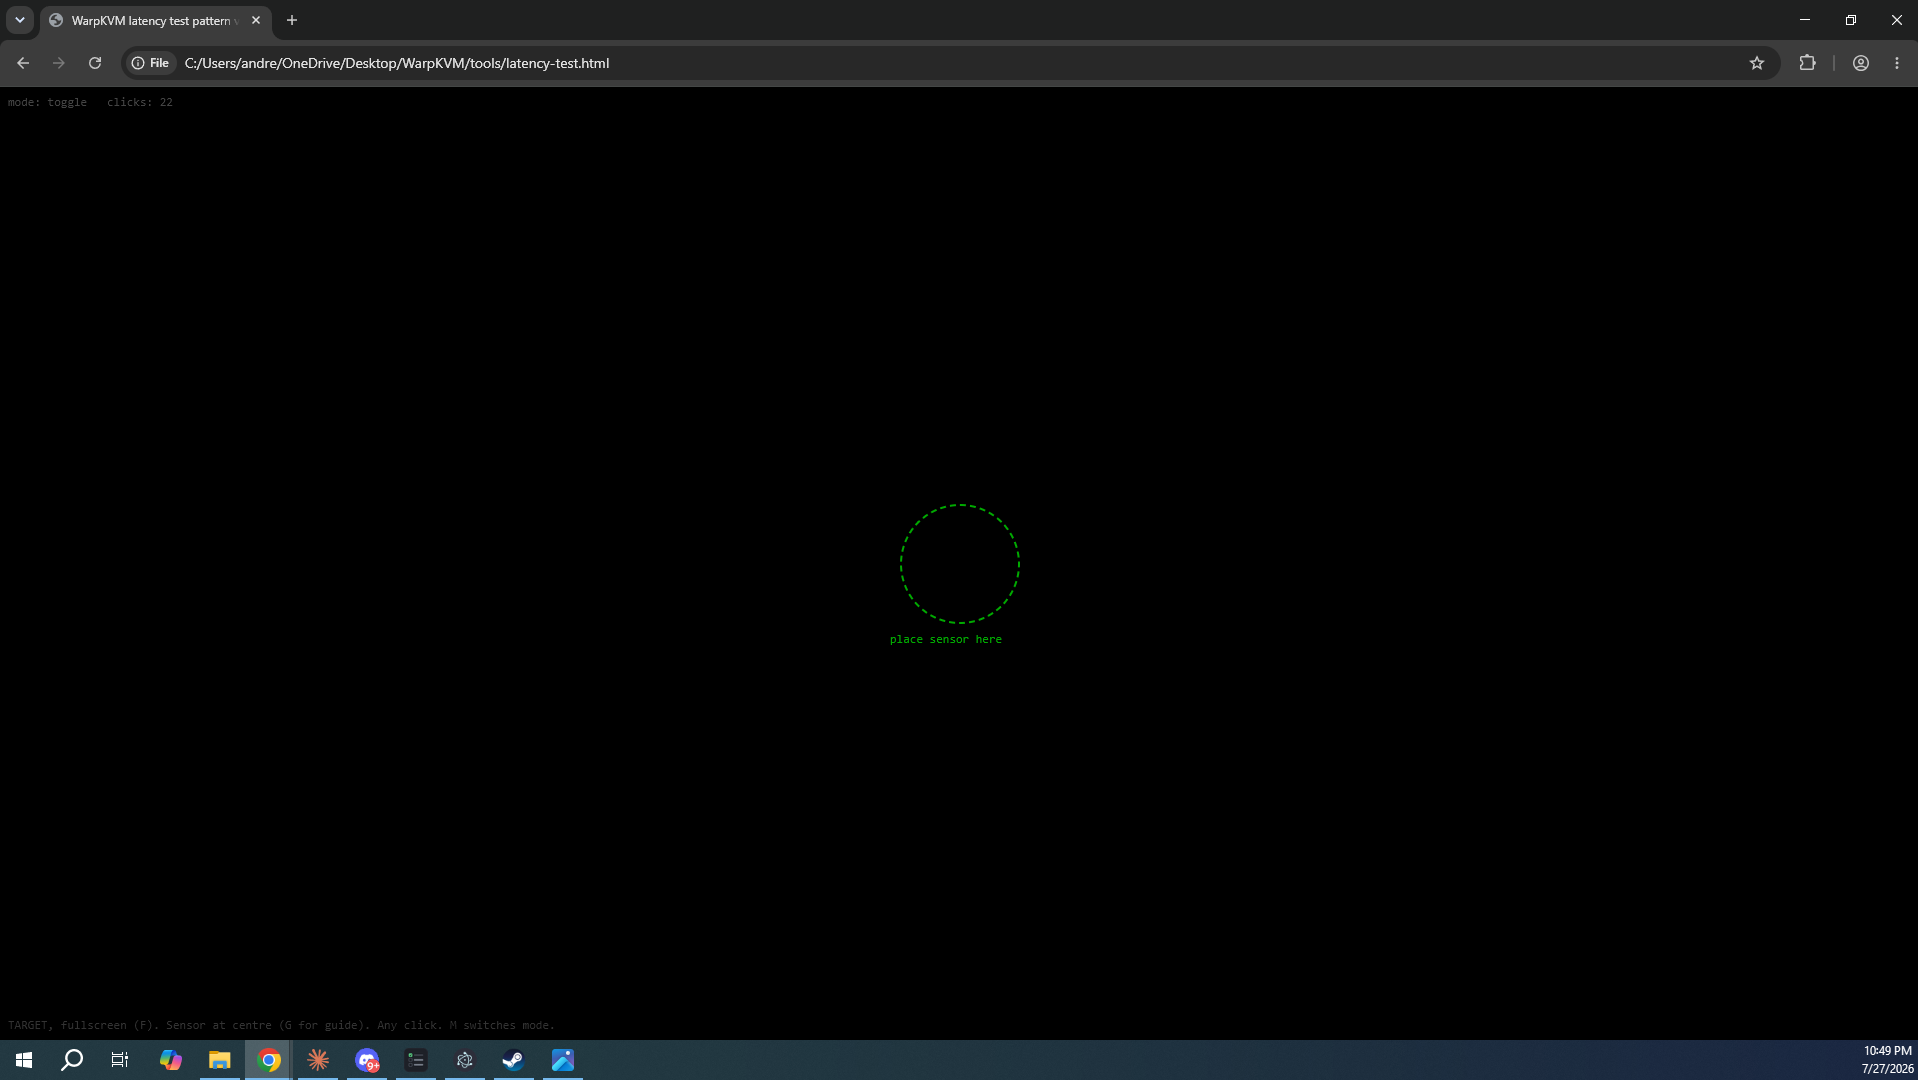
On the target we run a simple flash-test page: a full-screen area that flips color the instant it receives a click. We inject clicks through the KVM's own mouse emulation, so the click travels the real control path, and OSLTT times how long until the client screen flips. Automating the injected clicks lets us take a large sample rather than a handful of manual trials.
The method, step by step
Step 1
Fix the variables
Wired LAN, a fixed 1080p60 source, the same client and display, and each device set to comparable modes. Only the KVM changes between runs.
Step 2
Load the flash-test page
Open the full-screen flash page on the target through the KVM, and place the OSLTT sensor over the region on the client that shows it.
Step 3
Calibrate black and white
Sample the sensor against the page's full-black and full-white states through the KVM, then set the trigger threshold between them. Some KVMs shift the color profile slightly, so recalibrating per device keeps the screen-change detection honest before any timing runs.
Step 4
Inject clicks automatically
Fire clicks through the KVM's emulated mouse, at least 1,000 per device, so the sample is statistically meaningful rather than anecdotal.
Step 5
Record raw click-to-photon
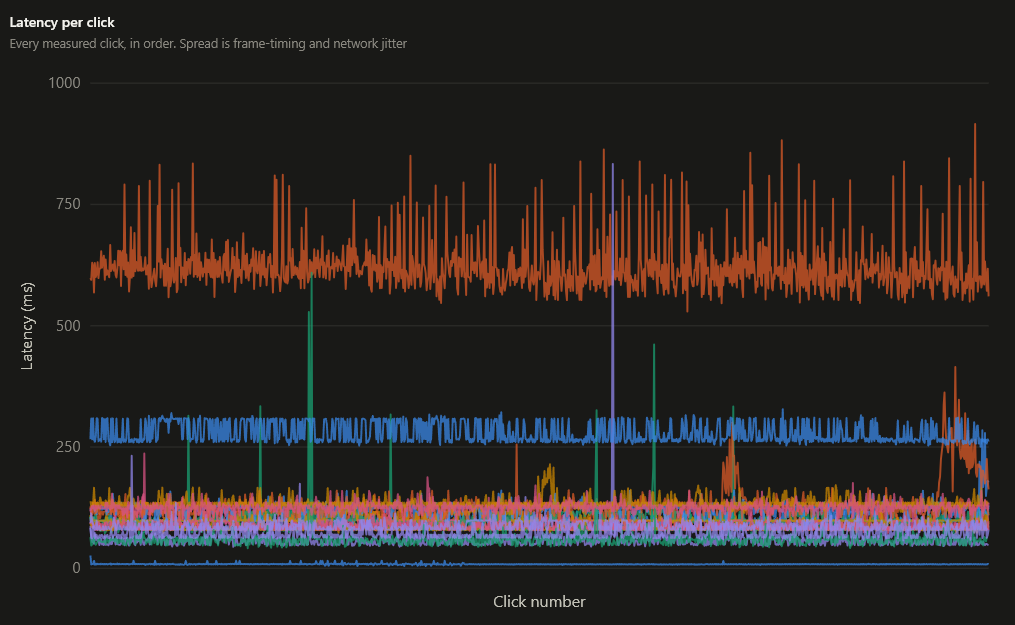
OSLTT logs the time from each injected click to the sensed screen change, producing a full distribution, not just an average.
Step 6
Subtract the display floor
We separately measure the client-local click-to-photon (about 14 ms on our display) and subtract it to isolate the latency the KVM adds.
Step 7
Report median and spread
We publish the median and the distribution, so a device with a good average but erratic spikes is not flattered by the number.
The statistics we report
A single average hides the behavior that actually annoys you: the occasional spike. So we take a large sample and report the shape, not just the center.
- 1,000 injected clicks per device. Enough that the median and the tails are stable, not an artifact of a handful of trials.
- Median, not mean. A device with a good average but frequent spikes should not be flattered by its number, so we lead with the median and publish the 5th-to-95th-percentile spread beside it.
- Nearest-rank percentiles. No interpolation or curve-fitting, so every figure maps to a real recorded event.
- False triggers removed. Readings under 1 ms are the sensor catching its own noise rather than a real screen change, so we drop them.
The baselines, and being honest about them
The number we most care about is the latency the KVM adds, so we first pin down the parts of the path that are not the KVM. We measured the same flash test three ways on the client with no KVM in the loop: automated USB click injection, a 1000 Hz wired gaming mouse, and a laptop trackpad. Automated injection is the honest floor at about 14 ms on our display. The gaming mouse added roughly 6 ms on top of that, and the trackpad added almost 42 ms, which is exactly why we inject clicks over USB for the published numbers rather than trust a physical device: the input hardware, not the KVM, would otherwise dominate the result. For the per-device figures we subtract the 14 ms automated floor to isolate the KVM-added latency. When we quote an end-to-end number that includes a real mouse, we add the measured 6 ms gaming-mouse constant and say so. These offsets are constant across devices, so device-to-device comparisons are unaffected, and we disclose them so readers can recalculate for their own input hardware.
What this rig does not measure
Being clear about the edges of a method is part of trusting it.
- Your network is not our network. We test over a wired LAN to hold that variable constant, so our figures are the device's floor. Wi-Fi, WAN, and VPN hops add latency on top, which we measure separately where it matters.
- One resolution, one source. Every device sees the same fixed 1080p60 signal from an identical source, which keeps the comparison fair but means a 4K stream or a weaker source will shift the absolute numbers.
- The median is not your worst case. We publish the spread precisely because the tail matters: a device can post a good median and still spike under load.
- The baselines are ours. The 14 ms display floor and the 6 ms mouse constant are specific to our client and input device. We subtract and disclose them so you can recalculate for yours.
Run it yourself
The reason to document any of this is that you should not have to take our word for it. The instrument is OSLTT, an open-source latency tester that anyone can build from the project or buy from its maker. Get one, inject clicks through the KVM's emulated USB, place the sensor on the client over the flash region, and you will get the same kind of distribution we publish. If your numbers disagree with ours, tell us why.
We would rather be corrected than trusted blindly. A benchmark only its author can run is a marketing asset. A benchmark anyone can run is a standard.
Why this matters
Most KVM latency claims are either vendor encode-time numbers (which ignore the network, decode, and display) or subjective impressions. A click-to-photon rig with an objective light sensor, a large automated sample, and disclosed baselines produces figures you can actually compare across devices and reproduce yourself. That is the whole point: our latency benchmarks are only as trustworthy as the method behind them, so here is the method. The related power methodology is in how we measure IP KVM power draw.
OSLTT is open-source hardware; our test protocol and the arithmetic behind our baselines are described here in full so the results can be reproduced. Disclosure: this is published by WarpKVM, which is developing an IP KVM of its own and holds itself to the same measurements.