October 21, 2026Explainer
How We Test IP KVMs: Our Rig, Protocol, and Data
Every number in our reviews comes from one bench, one method, applied identically to every device. Here is the whole rig and protocol, so you can trust the data.
By Andrew Douglass · Founder
Disclosure: Our articles contain affiliate links, including Amazon. If you buy through one, we may earn a commission at no extra cost to you, and as an Amazon Associate we earn from qualifying purchases. It never affects our testing, measurements, or verdicts. Full disclosure.
A KVM test methodology is the fixed, published procedure a reviewer uses to measure an IP KVM: the hardware rig, the signal path, the instruments, and the way results are recorded. It matters because latency, power and image-quality numbers are only comparable between devices when the bench behind them does not change.
Everything we publish about how we test IP KVMs comes down to one principle: the same rig, the same method, applied identically to every device, with the raw data shown. Most KVM coverage is vendor spec sheets and subjective impressions. Ours is measured, and this page is the full disclosure of how, so you can judge the numbers for yourself and, if you want, reproduce them. It also commits us to something: our own upcoming device faces the exact same bench, held to the exact same method.
Why we publish the method
A benchmark you cannot inspect is a benchmark you cannot trust. Vendors quote encode times that ignore the network and the display; reviewers quote feelings. We wanted numbers that are objective, comparable across devices, and honest about their limits. That standard is also why we rebuilt our latency rig in October 2026, when a stricter setup showed that the first one let refresh timing, the viewer PC and default settings move results more than the gaps between some devices. That means disclosing the rig, the sample sizes, the baselines we subtract, and the cases where a measurement is approximate. The four things we measure, latency, power, video quality, and internals, each have a dedicated protocol, linked below in full.
The bench, in one picture
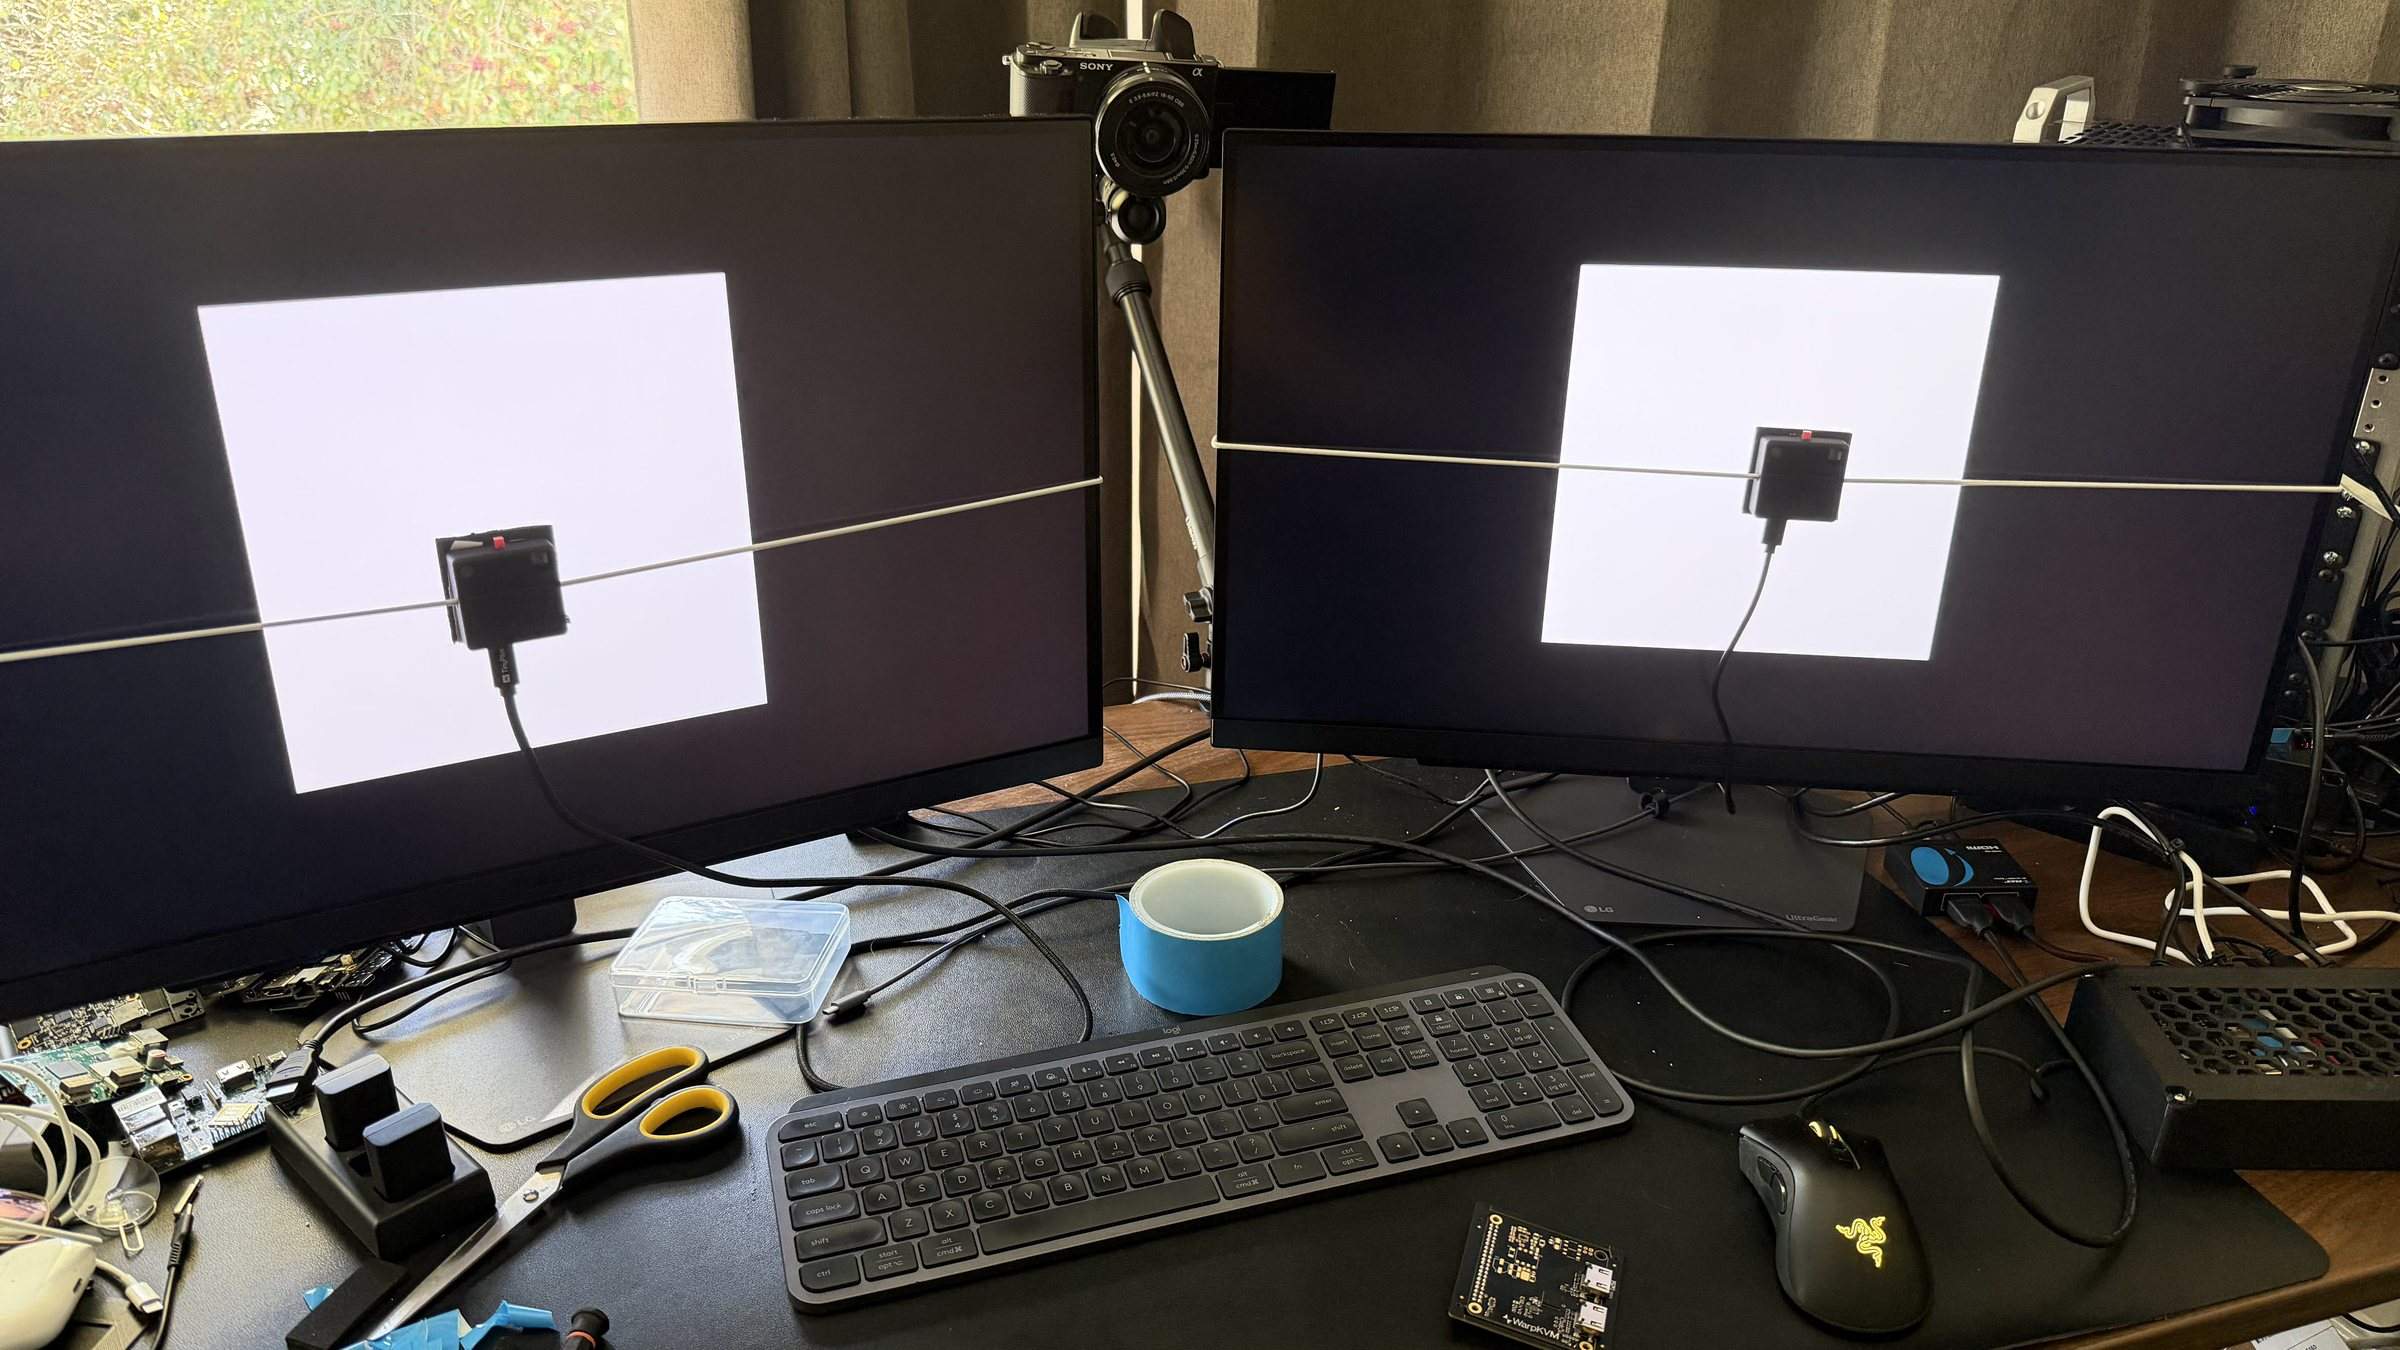
Every device is tested on one fixed rig so nothing varies but the KVM:
- A source machine drives the HDMI the KVM captures, so the signal is clean and identical for every device. For latency it is a small board that paints a test box and logs exactly when each paint lands, and an HDMI splitter sends the same picture to a reference monitor as well as to the KVM.
- The KVM under test captures that HDMI and emulates the keyboard and mouse, connected over a wired gigabit LAN through the same switch path for every device.
- A viewer PC (Windows 10) shows the KVM's stream full screen in Chrome, or in the vendor's own app, on a second monitor identical to the reference one. That is where we place instruments and take measurements.
Fixing these variables is the whole point: when only the KVM changes between runs, the differences we measure belong to the KVM.
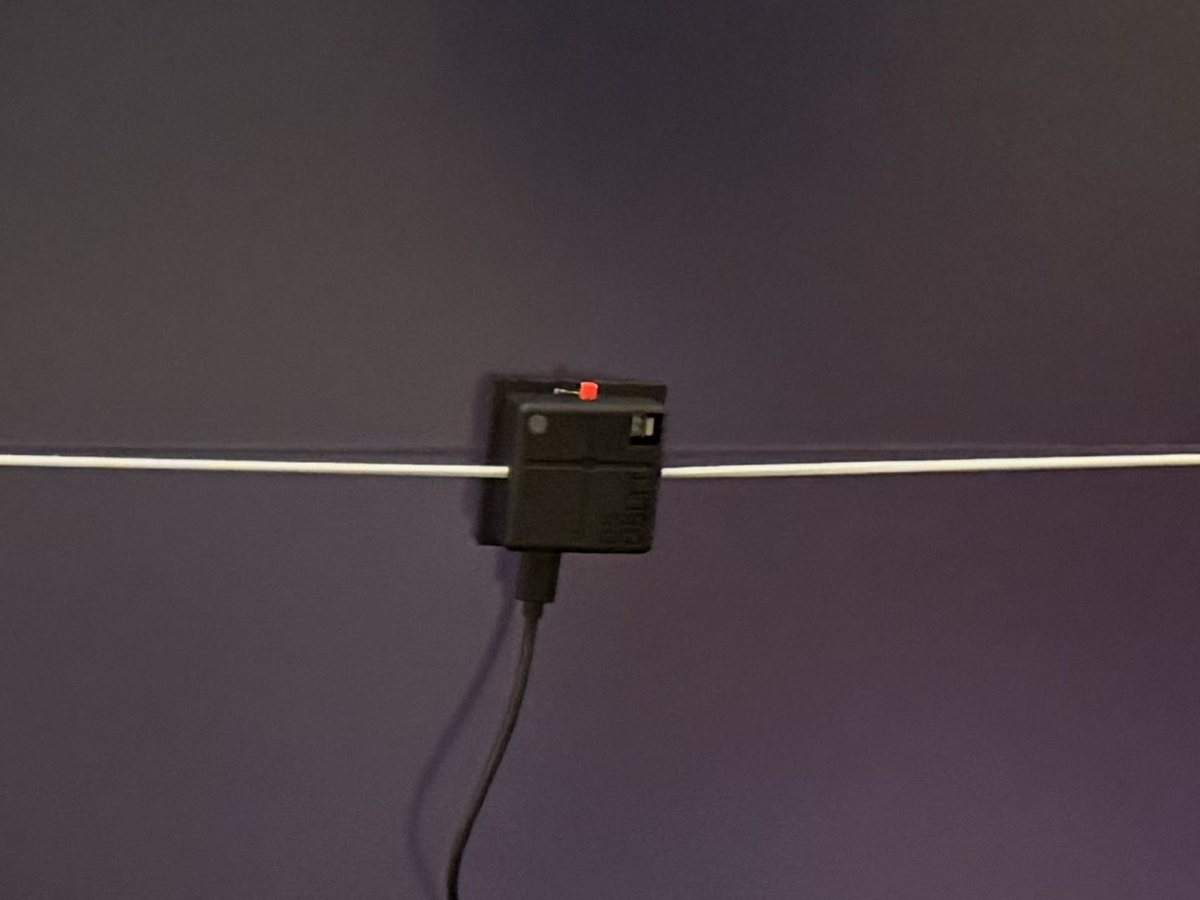
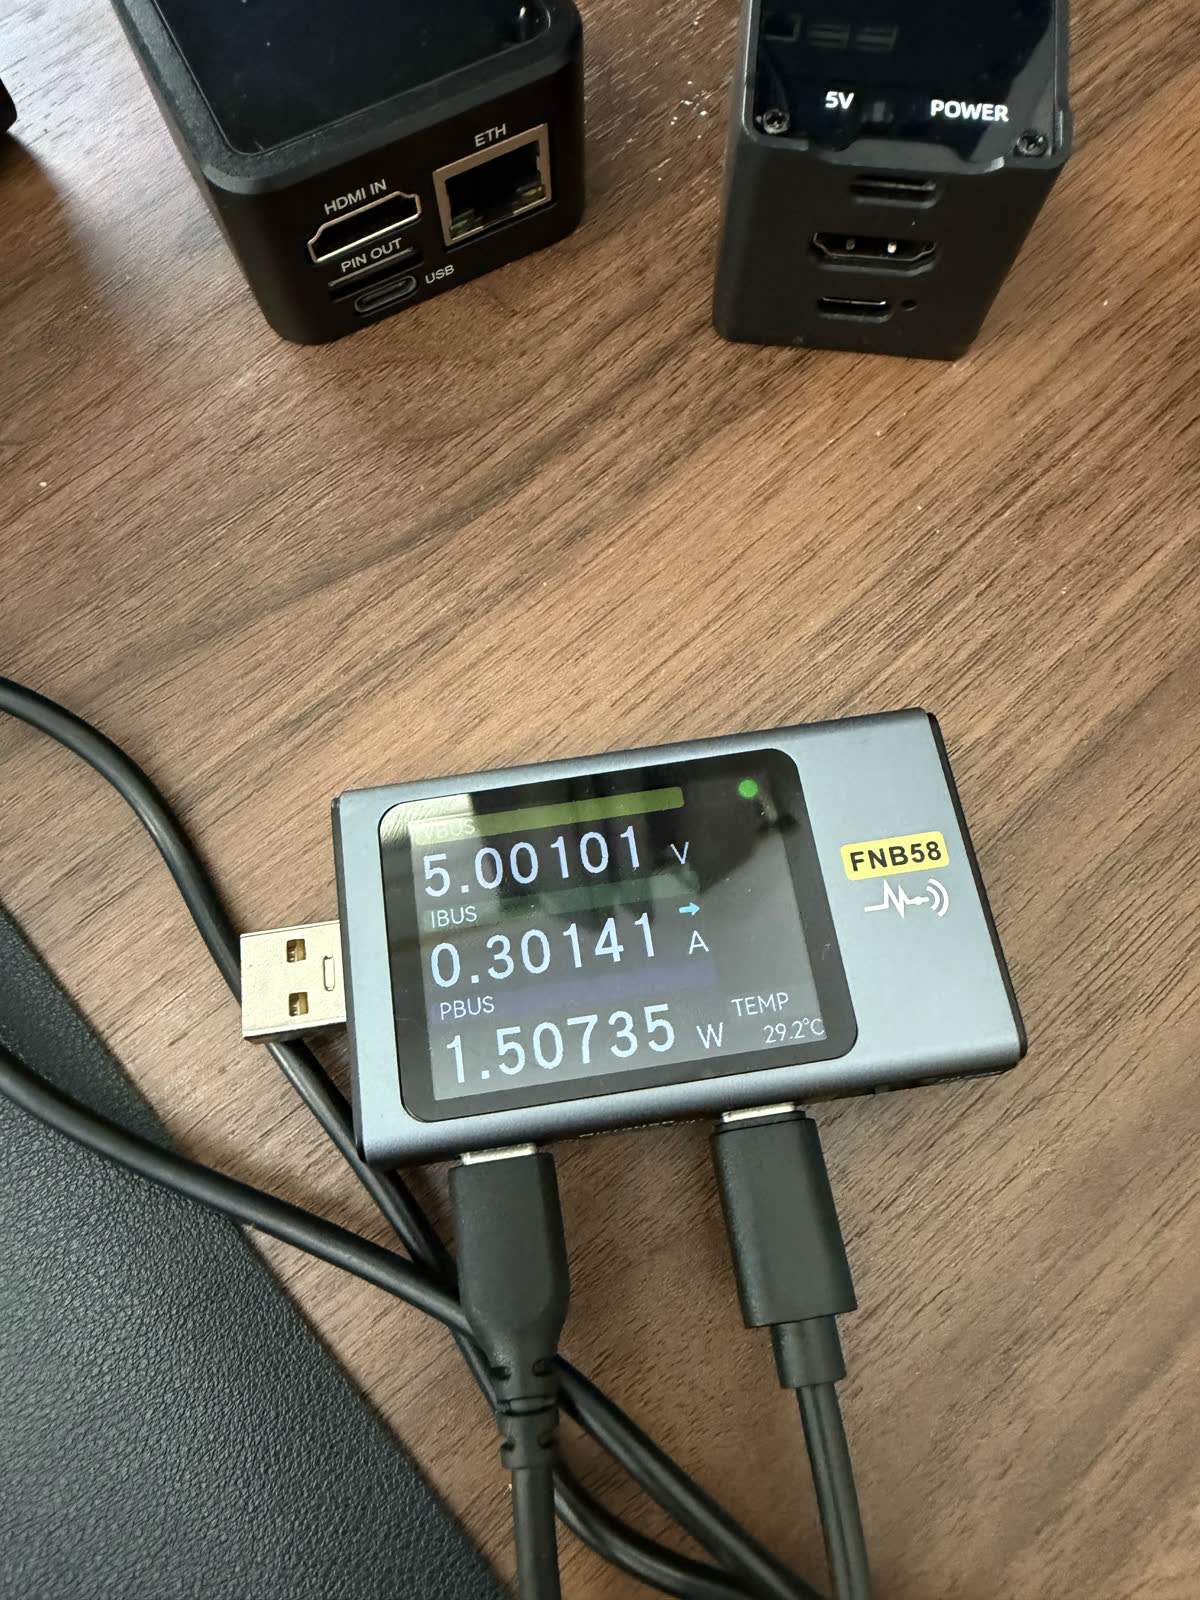
The instruments are off-the-shelf hardware, deliberately, so anyone can rebuild this bench. Latency is timed by two OSLTT units, the open-source latency tester by TechteamGB (sold as a hand-built unit), one per monitor. Each reads the brightness change on its screen and reports the timing over USB. They run our own test firmware, which adds the serial commands our runner needs; the light sensing is OSLTT's. Power is logged with an inline FNIRSI USB meter.
What we measure, and how
Step 1
Latency (glass-to-glass)
Two light sensors time the same test box on a reference monitor fed straight from an HDMI splitter and on an identical monitor showing the KVM's stream. The difference is the latency the KVM path adds: capture, encode, network, decode and display. 300 measurements per side, on scrolling text and on a still screen, balanced over the viewer monitor's refresh timing, with every device at its lowest-latency settings. Median and 95 % confidence interval reported. Full protocol in our glass-to-glass method writeup; results in the latency benchmarks.
Step 2
Power draw
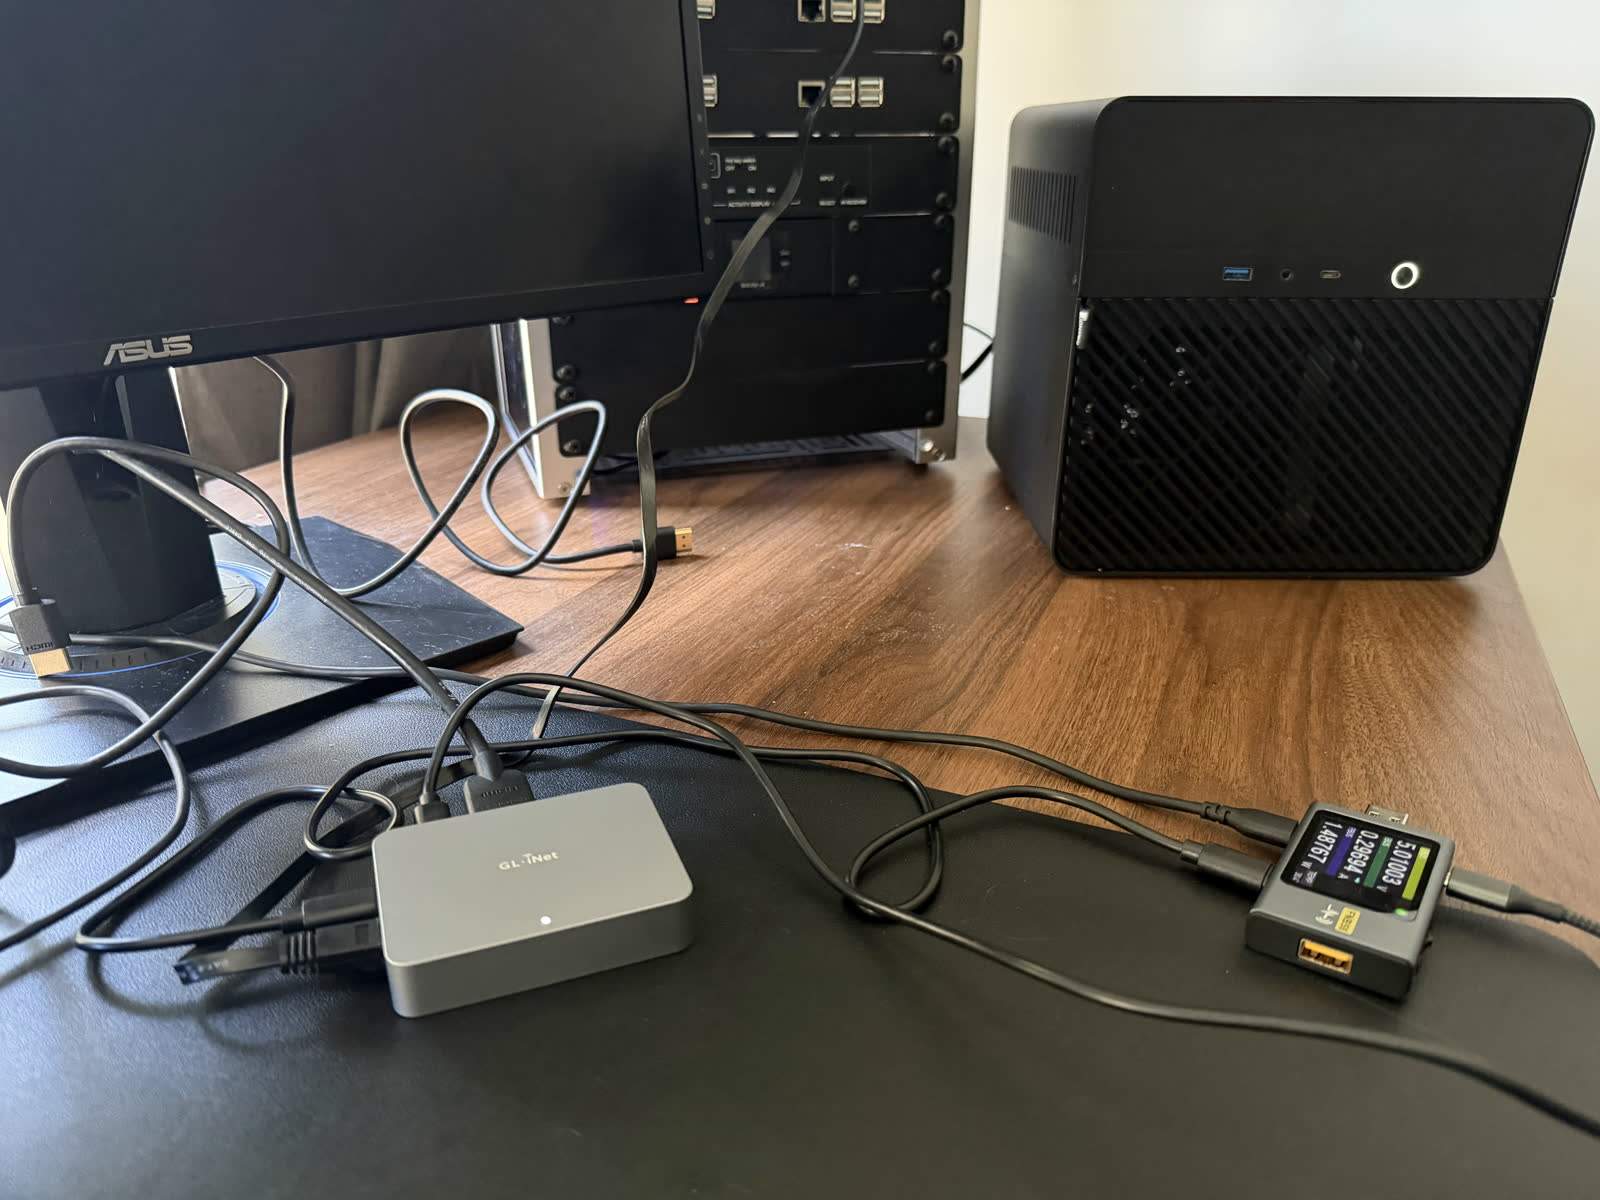
A FNIRSI USB meter inline on the power feed logs voltage and current at 50 Hz. We mark startup and streaming phases separately and report average watts (not energy, which depends on run length) plus the peak for power-supply sizing. Full protocol in our power method writeup.
Step 3
Video quality
We send an identical test pattern through every device and capture lossless client-side screenshots, then compare matched crops to expose banding, chroma bandwidth, and range clipping per device. Results in our video-quality comparison.
Step 4
Internals (teardown)
We open every device and cross-check it three ways: physical chip markings, live register reads over a root shell, and the running kernel, until we have a verified bill of materials. Full protocol in our teardown method writeup.
The detail pages
Rather than bury the protocols here, each lives in full on its own page so this stays a readable overview and the methods stay reproducible:
- Our glass-to-glass latency method: the two-monitor rig, the checks every run must pass, refresh-timing balancing, and what changed from our first rig.
- How we measure power: the FNIRSI setup, startup-versus-streaming segmentation, and why we report watts.
- Our teardown method: opening without damage, reading chip markings, and decoding storage registers into a verified BOM.
And the results those methods produce:
- IP KVM latency benchmarks: every device's measured glass-to-glass latency at 1080p60, 1080p120 and 4K.
- Power consumption compared: streaming, startup, and peak watts.
- Video quality compared: matched crops across the fleet.
- The capture chip database and storage provenance report: what the teardowns found.
The rules we hold ourselves to
A method is only as good as its honesty, so a few standing commitments:
- Identical conditions. Same source, splitter, monitors, viewer PC and network path for every device. When a device cannot deliver a mode, we say so rather than estimate it.
- Real sample sizes. Latency medians come from 300 measurements per side with a 95 % confidence interval, not a hand-picked best run, and devices whose intervals overlap are reported as tied.
- Measured baselines. The only offset we remove is the one between the two monitors, measured at the start and end of every run with no KVM in the path. A run whose baseline drifts is thrown out.
- Honest caveats. Where a reading is approximate, for instance a device that draws part of its power from the target, we flag it rather than pretend precision.
- Best settings, recorded. Since October 2026 every device runs at its lowest-latency settings, set as an owner could set them, read back from the device and listed next to the result. Defaults often trade latency for picture quality, so they measured the default rather than the device.
The commitment
The reason to publish all of this is accountability. Any vendor can claim a latency figure; few will tell you how they got it or let you check. By showing the rig, the samples, and the baselines, we make our numbers falsifiable, which is the only kind worth trusting. Our own WarpKVM boards are measured on this same bench, with the same checks and the same 300-measurement runs as everything else, and labelled wherever they appear. No home-field advantage. The data starts with the latency benchmarks.
This page describes our own test methodology in full so the results across our reviews can be reproduced and challenged. Disclosure: it is published by WarpKVM, which is developing an IP KVM of its own and holds it to the same rig.